
An initial public offering, IPO, or stock market launch is the first sale of stock by a private company to the public. During 2019-2020 we could observe an IPO hype when hundreds of companies launched an IPO and did it successfully despite the fact that many of them were "dead inside" and before IPO had no profits prospects for growth. But this situation was not always the case. In this article, we'll see IPO statistics for 2014-2020 and compare the latest years to the average.
Companies used in the study
Overall, 455 American companies were checked, from 11 different sectors and many industries. All the companies launched their IPOs in the period from 2014 to 2020: 279 from 2014-2018 and 176 from 2019-2020.
| Ticker | Company name | IPO Date | Sector | Industry |
| AACQU | Artius Acquisition Inc. | 7/14/2020 | Financial | Shell Companies |
| ABTX | Allegiance Bancshares, Inc. | 10/8/2015 | Financial | Banks - Regional |
| ACCD | Accolade, Inc. | 7/2/2020 | Healthcare | Health Information Services |
| ACI | Albertsons Companies, Inc. | 6/26/2020 | Consumer Defensive | Grocery Stores |
| ACIA | Acacia Communications, Inc. | 5/13/2016 | Technology | Communication Equipment |
| ACMR | ACM Research, Inc. | 11/3/2017 | Technology | Semiconductor Equipment & Materials |
| ACRS | Aclaris Therapeutics, Inc. | 10/7/2015 | Healthcare | Biotechnology |
| ADIL | Adial Pharmaceuticals, Inc. | 7/27/2018 | Healthcare | Biotechnology |
| ADPT | Adaptive Biotechnologies Corporation | 6/27/2019 | Healthcare | Biotechnology |
| ADSW | Advanced Disposal Services, Inc. | 10/6/2016 | Industrials | Waste Management |
| AGLE | Aeglea BioTherapeutics, Inc. | 4/7/2016 | Healthcare | Biotechnology |
| AGS | PlayAGS, Inc. | 1/26/2018 | Consumer Cyclical | Gambling |
| AIMT | Aimmune Therapeutics, Inc. | 8/6/2015 | Healthcare | Biotechnology |
| AIRG | Airgain, Inc. | 8/12/2016 | Technology | Communication Equipment |
| AKCA | Akcea Therapeutics, Inc. | 7/14/2017 | Healthcare | Biotechnology |
| AKRO | Akero Therapeutics, Inc. | 6/20/2019 | Healthcare | Biotechnology |
| AKUS | Akouos, Inc. | 6/26/2020 | Healthcare | Biotechnology |
| ALEC | Alector, Inc. | 2/7/2019 | Healthcare | Biotechnology |
| ALLK | Allakos Inc. | 7/19/2018 | Healthcare | Biotechnology |
| ALLO | Allogene Therapeutics, Inc. | 10/11/2018 | Healthcare | Biotechnology |
| ALNA | Allena Pharmaceuticals, Inc. | 11/2/2017 | Healthcare | Biotechnology |
| ALRN | Aileron Therapeutics, Inc. | 6/29/2017 | Healthcare | Biotechnology |
| ALTR | Altair Engineering Inc. | 11/1/2017 | Technology | Software - Infrastructure |
| ALVR | Allovir, Inc. | 7/30/2020 | Healthcare | Biotechnology |
| AMK | AssetMark Financial Holdings, Inc. | 7/18/2019 | Financial | Asset Management |
| AMTI | Applied Molecular Transport Inc. | 6/5/2020 | Healthcare | Biotechnology |
| ANAB | AnaptysBio, Inc. | 1/26/2017 | Healthcare | Biotechnology |
| ANNX | Annexon Biosciences, Inc. | 7/24/2020 | Healthcare | Biotechnology |
| ANVS | Annovis Bio, Inc. | 1/29/2020 | Healthcare | Biotechnology |
| APLS | Apellis Pharmaceuticals, Inc. | 11/9/2017 | Healthcare | Biotechnology |
| APLT | Applied Therapeutics, Inc. | 5/14/2019 | Healthcare | Biotechnology |
| APPN | Appian Corporation | 5/25/2017 | Technology | Software - Infrastructure |
| APRE | Aprea Therapeutics, Inc. | 10/3/2019 | Healthcare | Biotechnology |
| APTX | Aptinyx Inc. | 6/21/2018 | Healthcare | Biotechnology |
| AQST | Aquestive Therapeutics, Inc. | 7/25/2018 | Healthcare | Biotechnology |
| AQUA | Evoqua Water Technologies Corp. | 11/2/2017 | Industrials | Pollution & Treatment Controls |
| ARA | American Renal Associates Holdings, Inc. | 4/21/2016 | Healthcare | Diagnostics & Research |
| ARDS | Aridis Pharmaceuticals, Inc. | 8/14/2018 | Healthcare | Biotechnology |
| ARLO | Arlo Technologies, Inc. | 8/3/2018 | Industrials | Security & Protection Services |
| ARQT | Arcutis Biotherapeutics, Inc. | 1/31/2020 | Healthcare | Biotechnology |
| ARVN | Arvinas, Inc. | 9/27/2018 | Healthcare | Biotechnology |
| ATKR | Atkore International Group Inc. | 6/10/2016 | Industrials | Specialty Industrial Machinery |
| ATNX | Athenex, Inc. | 6/14/2017 | Healthcare | Drug Manufacturers - Specialty & Generic |
| ATUS | Altice USA, Inc. | 6/22/2017 | Communication Services | Telecom Services |
| ATXI | Avenue Therapeutics, Inc. | 6/27/2017 | Healthcare | Biotechnology |
| AVLR | Avalara, Inc. | 6/15/2018 | Technology | Software - Application |
| AVRO | AVROBIO, Inc. | 6/21/2018 | Healthcare | Biotechnology |
| AVTR | Avantor, Inc. | 5/17/2019 | Basic Materials | Specialty Chemicals |
| AXLA | Axcella Health Inc. | 5/9/2019 | Healthcare | Biotechnology |
| AXNX | Axonics Modulation Technologies, Inc. | 10/31/2018 | Healthcare | Medical Devices |
| AXSM | Axsome Therapeutics, Inc. | 11/19/2015 | Healthcare | Biotechnology |
| AYX | Alteryx, Inc. | 3/24/2017 | Technology | Software - Application |
| AZEK | The AZEK Company Inc. | 6/12/2020 | Industrials | Building Products & Equipment |
| AZRX | AzurRx BioPharma, Inc. | 10/11/2016 | Healthcare | Biotechnology |
| BAND | Bandwidth Inc. | 11/10/2017 | Technology | Software - Infrastructure |
| BBIO | BridgeBio Pharma, Inc. | 6/27/2019 | Healthcare | Biotechnology |
| BCEL | Atreca, Inc. | 6/20/2019 | Healthcare | Biotechnology |
| BCSF | Bain Capital Specialty Finance, Inc. | 11/15/2018 | Financial | Asset Management |
| BDTX | Black Diamond Therapeutics, Inc. | 1/30/2020 | Healthcare | Biotechnology |
| BE | Bloom Energy Corporation | 7/25/2018 | Industrials | Electrical Equipment & Parts |
| BEAM | Beam Therapeutics Inc. | 2/6/2020 | Healthcare | Biotechnology |
| BHVN | Biohaven Pharmaceutical Holding Company Ltd. | 5/4/2017 | Healthcare | Biotechnology |
| BILL | Bill.com Holdings, Inc. | 12/12/2019 | Technology | Software - Application |
| BJ | BJ's Wholesale Club Holdings, Inc. | 6/28/2018 | Consumer Defensive | Discount Stores |
| BL | BlackLine, Inc. | 10/28/2016 | Technology | Software - Infrastructure |
| BLI | Berkeley Lights, Inc. | 7/17/2020 | Healthcare | Biotechnology |
| BRBR | BellRing Brands, Inc. | 10/17/2019 | Consumer Defensive | Packaged Foods |
| BRP | BRP Group, Inc. | 10/24/2019 | Financial | Insurance Brokers |
| BSTZ | BlackRock Science and Technology Trust II | 6/26/2019 | Financial | Closed-End Fund - Equity |
| BTAI | BioXcel Therapeutics, Inc. | 3/8/2018 | Healthcare | Biotechnology |
| BV | BrightView Holdings, Inc. | 6/28/2018 | Industrials | Specialty Business Services |
| BWB | Bridgewater Bancshares, Inc. | 3/14/2018 | Financial | Banks - Regional |
| BXG | Bluegreen Vacations Corporation | 11/17/2017 | Consumer Cyclical | Resorts & Casinos |
| BY | Byline Bancorp, Inc. | 6/30/2017 | Financial | Banks - Regional |
| BYND | Beyond Meat, Inc. | 5/2/2019 | Consumer Defensive | Packaged Foods |
| BYSI | BeyondSpring Inc. | 3/9/2017 | Healthcare | Biotechnology |
| CABA | Cabaletta Bio, Inc. | 10/25/2019 | Healthcare | Biotechnology |
| CADE | Cadence Bancorporation | 4/13/2017 | Financial | Banks - Regional |
| CARG | CarGurus, Inc. | 10/12/2017 | Communication Services | Internet Content & Information |
| CASA | Casa Systems, Inc. | 12/15/2017 | Technology | Communication Equipment |
| CBTX | CBTX, Inc. | 11/8/2017 | Financial | Banks - Regional |
| CDAY | Ceridian HCM Holding Inc. | 4/26/2018 | Technology | Software - Application |
| CDLX | Cardlytics, Inc. | 2/9/2018 | Communication Services | Internet Content & Information |
| CELC | Celcuity Inc. | 9/20/2017 | Healthcare | Diagnostics & Research |
| CGBD | TCG BDC, Inc. | 6/14/2017 | Financial | Asset Management |
| CGROU | Collective Growth Corporation | 5/1/2020 | Financial | Shell Companies |
| CHNG | Change Healthcare Inc. | 6/27/2019 | Healthcare | Health Information Services |
| CHRA | Charah Solutions, Inc. | 6/14/2018 | Industrials | Waste Management |
| CHWY | Chewy, Inc. | 6/14/2019 | Consumer Cyclical | Internet Retail |
| CLDR | Cloudera, Inc. | 4/28/2017 | Technology | Software - Application |
| CLSD | Clearside Biomedical, Inc. | 6/2/2016 | Healthcare | Biotechnology |
| CLXT | Calyxt, Inc. | 7/20/2017 | Consumer Defensive | Packaged Foods |
| CMBM | Cambium Networks Corporation | 6/26/2019 | Technology | Communication Equipment |
| CNFR | Conifer Holdings, Inc. | 8/13/2015 | Financial | Insurance - Property & Casualty |
| CNSP | CNS Pharmaceuticals, Inc. | 11/8/2019 | Healthcare | Biotechnology |
| CNST | Constellation Pharmaceuticals, Inc. | 7/19/2018 | Healthcare | Biotechnology |
| CODX | Co-Diagnostics, Inc. | 7/12/2017 | Healthcare | Diagnostics & Research |
| COUP | Coupa Software Incorporated | 10/6/2016 | Technology | Software - Application |
| CRNX | Crinetics Pharmaceuticals, Inc. | 7/18/2018 | Healthcare | Biotechnology |
| CRTX | Cortexyme, Inc. | 5/9/2019 | Healthcare | Biotechnology |
| CRVS | Corvus Pharmaceuticals, Inc. | 3/23/2016 | Healthcare | Biotechnology |
| CRWD | CrowdStrike Holdings, Inc. | 6/12/2019 | Technology | Software - Infrastructure |
| CSPR | Casper Sleep Inc. | 2/6/2020 | Consumer Cyclical | Furnishings, Fixtures & Appliances |
| CSTL | Castle Biosciences, Inc. | 7/25/2019 | Healthcare | Diagnostics & Research |
| CSTR | Capstar Financial Holdings, Inc. | 9/22/2016 | Financial | Banks - Regional |
| CTMX | CytomX Therapeutics, Inc. | 10/8/2015 | Healthcare | Biotechnology |
| CURO | CURO Group Holdings Corp. | 12/7/2017 | Financial | Credit Services |
| CVNA | Carvana Co. | 4/28/2017 | Consumer Cyclical | Internet Retail |
| CWH | Camping World Holdings, Inc. | 10/7/2016 | Consumer Cyclical | Recreational Vehicles |
| CWK | Cushman & Wakefield plc | 8/2/2018 | Real Estate | Real Estate Services |
| DBX | Dropbox, Inc. | 3/23/2018 | Technology | Software - Infrastructure |
| DCPH | Deciphera Pharmaceuticals, Inc. | 9/28/2017 | Healthcare | Biotechnology |
| DDOG | Datadog, Inc. | 9/19/2019 | Technology | Software - Application |
| DFPHU | DFP Healthcare Acquisitions Corp. | 3/11/2020 | Financial | Shell Companies |
| DLTH | Duluth Holdings Inc. | 11/20/2015 | Consumer Cyclical | Apparel Retail |
| DNB | Dun & Bradstreet Holdings, Inc. | 7/1/2020 | Technology | Information Technology Services |
| DNLI | Denali Therapeutics Inc. | 12/8/2017 | Healthcare | Biotechnology |
| DOCU | DocuSign, Inc. | 4/27/2018 | Technology | Software - Application |
| DOMO | Domo, Inc. | 6/29/2018 | Technology | Software - Application |
| DT | Dynatrace, Inc. | 8/1/2019 | Technology | Software - Application |
| DTIL | Precision BioSciences, Inc. | 3/28/2019 | Healthcare | Biotechnology |
| EAF | GrafTech International Ltd. | 4/19/2018 | Industrials | Electrical Equipment & Parts |
| EB | Eventbrite, Inc. | 9/20/2018 | Technology | Software - Application |
| ECOR | electroCore, Inc. | 6/22/2018 | Healthcare | Medical Instruments & Supplies |
| EDIT | Editas Medicine, Inc. | 2/3/2016 | Healthcare | Biotechnology |
| EEX | Emerald Holding, Inc. | 4/28/2017 | Communication Services | Advertising Agencies |
| EIDX | Eidos Therapeutics, Inc. | 6/20/2018 | Healthcare | Biotechnology |
| ELAN | Elanco Animal Health Incorporated | 9/20/2018 | Healthcare | Drug Manufacturers - Specialty & Generic |
| ELF | e.l.f. Beauty, Inc. | 9/22/2016 | Consumer Defensive | Household & Personal Products |
| ELVT | Elevate Credit, Inc. | 4/6/2017 | Financial | Credit Services |
| EOLS | Evolus, Inc. | 2/8/2018 | Healthcare | Drug Manufacturers - Specialty & Generic |
| EPRT | Essential Properties Realty Trust, Inc. | 6/21/2018 | Real Estate | REIT - Diversified |
| EQ | Equillium, Inc. | 10/12/2018 | Healthcare | Biotechnology |
| EQBK | Equity Bancshares, Inc. | 11/11/2015 | Financial | Banks - Regional |
| EQH | Equitable Holdings, Inc. | 5/10/2018 | Financial | Insurance - Diversified |
| ESQ | Esquire Financial Holdings, Inc. | 6/27/2017 | Financial | Banks - Regional |
| ESTC | Elastic N.V. | 10/5/2018 | Technology | Software - Application |
| ETACU | E Merge Technology Acquisition Corp. | 7/31/2020 | Financial | Shell Companies |
| ETNB | 89bio, Inc. | 11/11/2019 | Healthcare | Biotechnology |
| ETON | Eton Pharmaceuticals, Inc. | 11/13/2018 | Healthcare | Biotechnology |
| ETTX | Entasis Therapeutics Holdings Inc. | 9/26/2018 | Healthcare | Biotechnology |
| EVBG | Everbridge, Inc. | 9/16/2016 | Technology | Software - Application |
| EVER | EverQuote, Inc. | 6/28/2018 | Communication Services | Internet Content & Information |
| EVLO | Evelo Biosciences, Inc. | 5/9/2018 | Healthcare | Biotechnology |
| EVOP | EVO Payments, Inc. | 5/23/2018 | Technology | Software - Infrastructure |
| EYE | National Vision Holdings, Inc. | 10/26/2017 | Consumer Cyclical | Specialty Retail |
| EYEN | Eyenovia, Inc. | 1/25/2018 | Healthcare | Biotechnology |
| FBK | FB Financial Corporation | 9/16/2016 | Financial | Banks - Regional |
| FBM | Foundation Building Materials, Inc. | 2/10/2017 | Industrials | Industrial Distribution |
| FHB | First Hawaiian, Inc. | 8/4/2016 | Financial | Banks - Regional |
| FIXX | Homology Medicines, Inc. | 3/28/2018 | Healthcare | Biotechnology |
| FLGT | Fulgent Genetics, Inc. | 9/29/2016 | Healthcare | Diagnostics & Research |
| FMTX | Forma Therapeutics Holdings, Inc. | 6/19/2020 | Healthcare | Biotechnology |
| FNKO | Funko, Inc. | 11/2/2017 | Consumer Cyclical | Leisure |
| FOCS | Focus Financial Partners Inc. | 7/26/2018 | Financial | Capital Markets |
| FOUR | Shift4 Payments, Inc. | 6/5/2020 | Technology | Software - Infrastructure |
| FPH | Five Point Holdings, LLC | 5/10/2017 | Real Estate | Real Estate - Development |
| FREQ | Frequency Therapeutics, Inc. | 10/3/2019 | Healthcare | Biotechnology |
| FRTA | Forterra, Inc. | 10/20/2016 | Industrials | Building Products & Equipment |
| FSCT | Forescout Technologies, Inc. | 10/27/2017 | Technology | Software - Application |
| FSLY | Fastly, Inc. | 5/17/2019 | Technology | Software - Application |
| FULC | Fulcrum Therapeutics, Inc. | 7/18/2019 | Healthcare | Biotechnology |
| GBIO | Generation Bio Co. | 6/12/2020 | Healthcare | Biotechnology |
| GBT | Global Blood Therapeutics, Inc. | 8/12/2015 | Healthcare | Biotechnology |
| GH | Guardant Health, Inc. | 10/4/2018 | Healthcare | Diagnostics & Research |
| GHSI | Guardion Health Sciences, Inc. | 4/5/2019 | Healthcare | Drug Manufacturers - Specialty & Generic |
| GMS | GMS Inc. | 5/26/2016 | Industrials | Building Products & Equipment |
| GNPX | Genprex, Inc. | 3/29/2018 | Healthcare | Biotechnology |
| GO | Grocery Outlet Holding Corp. | 6/20/2019 | Consumer Defensive | Grocery Stores |
| GOCO | GoHealth, Inc. | 7/15/2020 | Financial | Insurance Brokers |
| GOED | 1847 Goedeker Inc. | 7/31/2020 | Consumer Cyclical | Internet Retail |
| GOLF | Acushnet Holdings Corp. | 10/28/2016 | Consumer Cyclical | Leisure |
| GOSS | Gossamer Bio, Inc. | 2/8/2019 | Healthcare | Biotechnology |
| GPMT | Granite Point Mortgage Trust Inc. | 6/23/2017 | Real Estate | REIT - Mortgage |
| GRIL | Muscle Maker, Inc. | 2/13/2020 | Consumer Cyclical | Restaurants |
| GRTS | Gritstone Oncology, Inc. | 9/28/2018 | Healthcare | Biotechnology |
| GRTX | Galera Therapeutics, Inc. | 11/7/2019 | Healthcare | Biotechnology |
| GSHD | Goosehead Insurance, Inc | 4/27/2018 | Financial | Insurance - Diversified |
| GSKY | GreenSky, Inc. | 5/24/2018 | Technology | Software - Infrastructure |
| GTES | Gates Industrial Corporation plc | 1/25/2018 | Industrials | Specialty Industrial Machinery |
| GTHX | G1 Therapeutics, Inc. | 5/17/2017 | Healthcare | Biotechnology |
| HARP | Harpoon Therapeutics, Inc. | 2/8/2019 | Healthcare | Biotechnology |
| HBT | HBT Financial, Inc. | 10/11/2019 | Financial | Banks - Regional |
| HCAT | Health Catalyst, Inc. | 7/25/2019 | Healthcare | Health Information Services |
| HCC | Warrior Met Coal, Inc. | 4/13/2017 | Basic Materials | Coking Coal |
| HECCU | Hudson Executive Investment Corp. | 6/9/2020 | Financial | Shell Companies |
| HLI | Houlihan Lokey, Inc. | 8/13/2015 | Financial | Capital Markets |
| HLNE | Hamilton Lane Incorporated | 3/1/2017 | Financial | Asset Management |
| HOME | At Home Group Inc. | 8/4/2016 | Consumer Cyclical | Specialty Retail |
| HOOK | HOOKIPA Pharma Inc. | 4/18/2019 | Healthcare | Biotechnology |
| HOTH | Hoth Therapeutics, Inc. | 2/15/2019 | Healthcare | Biotechnology |
| HYRE | HyreCar Inc. | 6/27/2018 | Industrials | Rental & Leasing Services |
| ICHR | Ichor Holdings, Ltd. | 12/9/2016 | Technology | Semiconductor Equipment & Materials |
| IDYA | IDEAYA Biosciences, Inc. | 5/23/2019 | Healthcare | Biotechnology |
| IGMS | IGM Biosciences, Inc. | 9/18/2019 | Healthcare | Biotechnology |
| IIIV | i3 Verticals, Inc. | 6/21/2018 | Technology | Software - Infrastructure |
| IIPR | Innovative Industrial Properties, Inc. | 12/1/2016 | Real Estate | REIT - Industrial |
| ILPT | Industrial Logistics Properties Trust | 1/12/2018 | Real Estate | REIT - Industrial |
| IMRA | IMARA Inc. | 3/12/2020 | Healthcare | Biotechnology |
| INSP | Inspire Medical Systems, Inc. | 5/3/2018 | Healthcare | Medical Devices |
| INVH | Invitation Homes Inc. | 2/1/2017 | Real Estate | REIT - Residential |
| INZY | Inozyme Pharma, Inc. | 7/24/2020 | Healthcare | Biotechnology |
| IRTC | iRhythm Technologies, Inc. | 10/20/2016 | Healthcare | Medical Instruments & Supplies |
| ITOS | Iteos Therapeutics, Inc. | 7/24/2020 | Healthcare | Biotechnology |
| JAMF | Jamf Holding Corp. | 7/22/2020 | Financial | Exchange Traded Fund |
| JILL | J.Jill, Inc. | 3/9/2017 | Consumer Cyclical | Apparel Retail |
| JNCE | Jounce Therapeutics, Inc. | 1/27/2017 | Healthcare | Biotechnology |
| KALA | Kala Pharmaceuticals, Inc. | 7/20/2017 | Healthcare | Biotechnology |
| KDMN | Kadmon Holdings, Inc. | 7/27/2016 | Healthcare | Biotechnology |
| KIDS | OrthoPediatrics Corp. | 10/12/2017 | Healthcare | Medical Devices |
| KLDO | Kaleido Biosciences, Inc. | 2/28/2019 | Healthcare | Biotechnology |
| KNSL | Kinsale Capital Group, Inc. | 7/28/2016 | Financial | Insurance - Property & Casualty |
| KOD | Kodiak Sciences Inc. | 10/4/2018 | Healthcare | Biotechnology |
| KREF | KKR Real Estate Finance Trust Inc. | 5/5/2017 | Real Estate | REIT - Mortgage |
| KROS | Keros Therapeutics, Inc. | 4/8/2020 | Healthcare | Biotechnology |
| KRP | Kimbell Royalty Partners, LP | 2/3/2017 | Energy | Oil & Gas E&P |
| KRTX | Karuna Therapeutics, Inc. | 6/28/2019 | Healthcare | Biotechnology |
| KRUS | Kura Sushi USA, Inc. | 8/1/2019 | Consumer Cyclical | Restaurants |
| KRYS | Krystal Biotech, Inc. | 9/20/2017 | Healthcare | Biotechnology |
| KZR | Kezar Life Sciences, Inc. | 6/21/2018 | Healthcare | Biotechnology |
| LASR | nLIGHT, Inc. | 4/26/2018 | Technology | Semiconductors |
| LAUR | Laureate Education, Inc. | 2/1/2017 | Consumer Defensive | Education & Training Services |
| LBC | Luther Burbank Corporation | 12/8/2017 | Financial | Banks - Regional |
| LBRT | Liberty Oilfield Services Inc. | 1/12/2018 | Energy | Oil & Gas Equipment & Services |
| LEGH | Legacy Housing Corporation | 12/14/2018 | Consumer Cyclical | Residential Construction |
| LEGN | Legend Biotech Corporation | 6/5/2020 | Healthcare | Biotechnology |
| LEVI | Levi Strauss & Co. | 3/21/2019 | Consumer Cyclical | Apparel Manufacturing |
| LMND | Lemonade, Inc. | 7/2/2020 | Financial | Insurance - Property & Casualty |
| LMPX | LMP Automotive Holdings, Inc. | 12/5/2019 | Consumer Cyclical | Auto & Truck Dealerships |
| LOGC | LogicBio Therapeutics, Inc. | 10/19/2018 | Healthcare | Biotechnology |
| LOVE | The Lovesac Company | 6/27/2018 | Consumer Cyclical | Furnishings, Fixtures & Appliances |
| LQDA | Liquidia Technologies, Inc. | 7/26/2018 | Healthcare | Biotechnology |
| LTHM | Livent Corporation | 10/11/2018 | Basic Materials | Specialty Chemicals |
| LTRN | Lantern Pharma Inc. | 6/11/2020 | Healthcare | Biotechnology |
| LVGO | Livongo Health, Inc. | 7/25/2019 | Healthcare | Medical Devices |
| LYFT | Lyft, Inc. | 3/29/2019 | Technology | Software - Application |
| LYRA | Lyra Therapeutics, Inc. | 5/1/2020 | Healthcare | Biotechnology |
| MBIN | Merchants Bancorp | 10/27/2017 | Financial | Banks - Regional |
| MCACU | Mountain Crest Acquisition Corp | 6/5/2020 | Financial | Shell Companies |
| MCB | Metropolitan Bank Holding Corp. | 11/8/2017 | Financial | Banks - Regional |
| MDB | MongoDB, Inc. | 10/19/2017 | Technology | Software - Infrastructure |
| MDLA | Medallia, Inc. | 7/19/2019 | Technology | Software - Application |
| MEC | Mayville Engineering Company, Inc. | 5/9/2019 | Industrials | Metal Fabrication |
| MEDP | Medpace Holdings, Inc. | 8/11/2016 | Healthcare | Diagnostics & Research |
| MESA | Mesa Air Group, Inc. | 8/10/2018 | Industrials | Airlines |
| METC | Ramaco Resources, Inc. | 2/3/2017 | Basic Materials | Coking Coal |
| MGP | MGM Growth Properties LLC | 4/20/2016 | Real Estate | REIT - Diversified |
| MGTA | Magenta Therapeutics, Inc. | 6/21/2018 | Healthcare | Biotechnology |
| MGTX | MeiraGTx Holdings plc | 6/8/2018 | Healthcare | Biotechnology |
| MIRM | Mirum Pharmaceuticals, Inc. | 7/18/2019 | Healthcare | Biotechnology |
| MNLO | Menlo Therapeutics Inc. | 1/25/2018 | Healthcare | Biotechnology |
| MNPR | Monopar Therapeutics Inc. | 12/19/2019 | Healthcare | Biotechnology |
| MNRL | Brigham Minerals, Inc. | 4/18/2019 | Energy | Oil & Gas E&P |
| MORF | Morphic Holding, Inc. | 6/27/2019 | Healthcare | Biotechnology |
| MOTS | Motus GI Holdings, Inc. | 2/14/2018 | Healthcare | Diagnostics & Research |
| MRAM | Everspin Technologies, Inc. | 10/7/2016 | Technology | Semiconductors |
| MRNA | Moderna, Inc. | 12/7/2018 | Healthcare | Biotechnology |
| MRSN | Mersana Therapeutics, Inc. | 6/28/2017 | Healthcare | Biotechnology |
| MSBI | Midland States Bancorp, Inc. | 5/24/2016 | Financial | Banks - Regional |
| MWK | Mohawk Group Holdings, Inc. | 6/12/2019 | Technology | Consumer Electronics |
| MYOK | MyoKardia, Inc. | 10/29/2015 | Healthcare | Biotechnology |
| NBLX | Noble Midstream Partners LP | 9/15/2016 | Energy | Oil & Gas Midstream |
| NCNO | nCino, Inc. | 7/14/2020 | Technology | Software - Application |
| NCSM | NCS Multistage Holdings, Inc. | 4/28/2017 | Energy | Oil & Gas Equipment & Services |
| NET | Cloudflare, Inc. | 9/13/2019 | Technology | Software - Infrastructure |
| NFE | New Fortress Energy LLC | 1/31/2019 | Utilities | Utilities - Regulated Gas |
| NGM | NGM Biopharmaceuticals, Inc. | 4/4/2019 | Healthcare | Biotechnology |
| NH | NantHealth, Inc. | 6/2/2016 | Healthcare | Health Information Services |
| NHICU | Newhold Investment Corp. | 7/31/2020 | Financial | Shell Companies |
| NKTX | Nkarta, Inc. | 7/10/2020 | Healthcare | Biotechnology |
| NMRK | Newmark Group, Inc. | 12/15/2017 | Real Estate | Real Estate Services |
| NOVA | Sunnova Energy International Inc. | 7/25/2019 | Technology | Solar |
| NOVN | Novan, Inc. | 9/21/2016 | Healthcare | Biotechnology |
| NOVSU | Novus Capital Corporation | 5/15/2020 | Financial | Shell Companies |
| NPAUU | New Providence Acquisition Corp. | 9/11/2019 | Financial | Shell Companies |
| NREF | NexPoint Real Estate Finance, Inc. | 2/7/2020 | Real Estate | REIT - Diversified |
| NRIX | Nurix Therapeutics, Inc. | 7/24/2020 | Healthcare | Biotechnology |
| NTLA | Intellia Therapeutics, Inc. | 5/6/2016 | Healthcare | Biotechnology |
| NTNX | Nutanix, Inc. | 9/30/2016 | Technology | Software - Infrastructure |
| NVCR | NovoCure Limited | 10/2/2015 | Healthcare | Medical Instruments & Supplies |
| NVST | Envista Holdings Corporation | 9/18/2019 | Healthcare | Medical Instruments & Supplies |
| NXTC | NextCure, Inc. | 5/9/2019 | Healthcare | Biotechnology |
| OBNK | Origin Bancorp, Inc. | 5/9/2018 | Financial | Banks - Regional |
| ODT | Odonate Therapeutics, Inc. | 12/7/2017 | Healthcare | Biotechnology |
| OKTA | Okta, Inc. | 4/7/2017 | Technology | Software - Infrastructure |
| OMP | Oasis Midstream Partners LP | 9/21/2017 | Energy | Oil & Gas Midstream |
| ONEW | OneWater Marine Inc. | 2/7/2020 | Consumer Cyclical | Recreational Vehicles |
| OPRT | Oportun Financial Corporation | 9/26/2019 | Financial | Credit Services |
| OPTN | OptiNose, Inc. | 10/13/2017 | Healthcare | Drug Manufacturers - Specialty & Generic |
| ORCC | Owl Rock Capital Corporation | 7/18/2019 | Financial | Credit Services |
| ORIC | ORIC Pharmaceuticals, Inc. | 4/24/2020 | Healthcare | Biotechnology |
| OSMT | Osmotica Pharmaceuticals plc | 10/18/2018 | Healthcare | Biotechnology |
| OSS | One Stop Systems, Inc. | 2/1/2018 | Technology | Computer Hardware |
| OVID | Ovid Therapeutics Inc. | 5/5/2017 | Healthcare | Biotechnology |
| OYST | Oyster Point Pharma, Inc. | 10/31/2019 | Healthcare | Biotechnology |
| PAND | Pandion Therapeutics Holdco LLC | 7/17/2020 | Healthcare | Biotechnology |
| PASG | Passage Bio, Inc. | 2/28/2020 | Healthcare | Biotechnology |
| PCVX | Vaxcyte, Inc. | 6/12/2020 | Healthcare | Biotechnology |
| PD | PagerDuty, Inc. | 4/11/2019 | Technology | Software - Application |
| PEN | Penumbra, Inc. | 9/18/2015 | Healthcare | Medical Devices |
| PETQ | PetIQ, Inc. | 7/21/2017 | Healthcare | Drug Manufacturers - Specialty & Generic |
| PGNY | Progyny, Inc. | 10/25/2019 | Healthcare | Health Information Services |
| PHAS | PhaseBio Pharmaceuticals, Inc. | 10/18/2018 | Healthcare | Biotechnology |
| PHAT | Phathom Pharmaceuticals, Inc. | 10/25/2019 | Healthcare | Biotechnology |
| PHR | Phreesia, Inc. | 7/18/2019 | Healthcare | Health Information Services |
| PI | Impinj, Inc. | 7/21/2016 | Technology | Communication Equipment |
| PINE | Alpine Income Property Trust, Inc. | 11/22/2019 | Real Estate | REIT - Diversified |
| PING | Ping Identity Holding Corp. | 9/19/2019 | Technology | Software - Infrastructure |
| PINS | Pinterest, Inc. | 4/18/2019 | Communication Services | Internet Content & Information |
| PLAN | Anaplan, Inc. | 10/12/2018 | Technology | Software - Infrastructure |
| PLMR | Palomar Holdings, Inc. | 4/17/2019 | Financial | Insurance - Property & Casualty |
| PLNT | Planet Fitness, Inc. | 8/6/2015 | Consumer Cyclical | Leisure |
| PLRX | Pliant Therapeutics, Inc. | 6/3/2020 | Healthcare | Biotechnology |
| PLYM | Plymouth Industrial REIT, Inc. | 6/9/2017 | Real Estate | REIT - Industrial |
| POLA | Polar Power, Inc. | 12/7/2016 | Industrials | Electrical Equipment & Parts |
| PPD | PPD, Inc. | 2/6/2020 | Healthcare | Drug Manufacturers - Specialty & Generic |
| PRNB | Principia Biopharma Inc. | 9/14/2018 | Healthcare | Biotechnology |
| PROG | Progenity, Inc. | 6/19/2020 | Healthcare | Biotechnology |
| PROS | ProSight Global, Inc. | 7/25/2019 | Financial | Insurance - Specialty |
| PRT | PermRock Royalty Trust | 5/2/2018 | Energy | Oil & Gas Equipment & Services |
| PS | Pluralsight, Inc. | 5/17/2018 | Technology | Software - Application |
| PSN | Parsons Corporation | 5/8/2019 | Industrials | Specialty Industrial Machinery |
| PSNL | Personalis, Inc. | 6/20/2019 | Healthcare | Biotechnology |
| PSTG | Pure Storage, Inc. | 10/7/2015 | Technology | Computer Hardware |
| PSTL | Postal Realty Trust, Inc. | 5/15/2019 | Real Estate | REIT - Office |
| PSTX | Poseida Therapeutics, Inc. | 7/10/2020 | Healthcare | Biotechnology |
| PTGX | Protagonist Therapeutics, Inc. | 8/11/2016 | Healthcare | Biotechnology |
| PTI | Proteostasis Therapeutics, Inc. | 2/11/2016 | Healthcare | Biotechnology |
| PTON | Peloton Interactive, Inc. | 9/26/2019 | Consumer Cyclical | Leisure |
| PUMP | ProPetro Holding Corp. | 3/17/2017 | Energy | Oil & Gas Equipment & Services |
| QES | Quintana Energy Services Inc. | 2/9/2018 | Energy | Oil & Gas Equipment & Services |
| QTRX | Quanterix Corporation | 12/7/2017 | Healthcare | Medical Devices |
| RAPT | RAPT Therapeutics, Inc. | 10/31/2019 | Healthcare | Biotechnology |
| RCUS | Arcus Biosciences, Inc. | 3/15/2018 | Healthcare | Biotechnology |
| RDFN | Redfin Corporation | 7/28/2017 | Real Estate | Real Estate Services |
| REAL | The RealReal, Inc. | 6/28/2019 | Consumer Cyclical | Specialty Retail |
| REPL | Replimune Group, Inc. | 7/20/2018 | Healthcare | Biotechnology |
| RETA | Reata Pharmaceuticals, Inc. | 5/26/2016 | Healthcare | Biotechnology |
| REYN | Reynolds Consumer Products Inc. | 1/31/2020 | Consumer Cyclical | Packaging & Containers |
| RGNX | REGENXBIO Inc. | 9/17/2015 | Healthcare | Biotechnology |
| RLAY | Relay Therapeutics, Inc. | 7/16/2020 | Healthcare | Biotechnology |
| RNA | Avidity Biosciences, Inc. | 6/12/2020 | Healthcare | Biotechnology |
| RNGR | Ranger Energy Services, Inc. | 8/11/2017 | Energy | Oil & Gas Equipment & Services |
| ROAD | Construction Partners, Inc. | 5/4/2018 | Industrials | Engineering & Construction |
| ROKU | Roku, Inc. | 9/28/2017 | Communication Services | Entertainment |
| RPRX | Royalty Pharma plc | 6/16/2020 | Healthcare | Biotechnology |
| RRBI | Red River Bancshares, Inc. | 5/3/2019 | Financial | Banks - Regional |
| RRR | Red Rock Resorts, Inc. | 4/27/2016 | Consumer Cyclical | Resorts & Casinos |
| RTLR | Rattler Midstream LP | 5/23/2019 | Energy | Oil & Gas Midstream |
| RUBY | Rubius Therapeutics, Inc. | 7/18/2018 | Healthcare | Biotechnology |
| RVLV | Revolve Group, Inc. | 6/7/2019 | Consumer Cyclical | Internet Retail |
| RVMD | Revolution Medicines, Inc. | 2/13/2020 | Healthcare | Biotechnology |
| SACH | Sachem Capital Corp. | 2/10/2017 | Real Estate | REIT - Mortgage |
| SAFE | Safehold Inc. | 6/22/2017 | Real Estate | REIT - Diversified |
| SAIL | SailPoint Technologies Holdings, Inc. | 11/17/2017 | Technology | Software - Infrastructure |
| SBPH | Spring Bank Pharmaceuticals, Inc. | 5/6/2016 | Healthcare | Biotechnology |
| SBT | Sterling Bancorp, Inc. (Southfield, MI) | 11/17/2017 | Financial | Banks - Regional |
| SCPH | scPharmaceuticals Inc. | 11/17/2017 | Healthcare | Biotechnology |
| SCPL | SciPlay Corporation | 5/3/2019 | Communication Services | Electronic Gaming & Multimedia |
| SCWX | SecureWorks Corp. | 4/22/2016 | Technology | Software - Infrastructure |
| SDC | SmileDirectClub, Inc. | 9/12/2019 | Healthcare | Medical Devices |
| SDGR | Schrodinger, Inc. | 2/6/2020 | Healthcare | Health Information Services |
| SELB | Selecta Biosciences, Inc. | 6/22/2016 | Healthcare | Biotechnology |
| SFIX | Stitch Fix, Inc. | 11/17/2017 | Consumer Cyclical | Specialty Retail |
| SGH | SMART Global Holdings, Inc. | 5/24/2017 | Technology | Semiconductors |
| SI | Silvergate Capital Corporation | 11/7/2019 | Financial | Banks - Regional |
| SIBN | SI-BONE, Inc. | 10/17/2018 | Healthcare | Medical Devices |
| SILK | Silk Road Medical, Inc | 4/4/2019 | Healthcare | Medical Devices |
| SITE | SiteOne Landscape Supply, Inc. | 5/12/2016 | Industrials | Industrial Distribution |
| SITM | SiTime Corporation | 11/21/2019 | Technology | Semiconductors |
| SLDB | Solid Biosciences Inc. | 1/26/2018 | Healthcare | Drug Manufacturers - Specialty & Generic |
| SLGG | Super League Gaming, Inc. | 2/26/2019 | Communication Services | Electronic Gaming & Multimedia |
| SLQT | SelectQuote, Inc. | 5/21/2020 | Financial | Insurance Brokers |
| SMAR | Smartsheet Inc. | 4/27/2018 | Technology | Software - Application |
| SMMCU | South Mountain Merger Corp. | 6/20/2019 | Financial | Shell Companies |
| SNAP | Snap Inc. | 3/2/2017 | Communication Services | Internet Content & Information |
| SND | Smart Sand, Inc. | 11/4/2016 | Energy | Oil & Gas Equipment & Services |
| SNDR | Schneider National, Inc. | 4/6/2017 | Industrials | Trucking |
| SNDX | Syndax Pharmaceuticals, Inc. | 3/3/2016 | Healthcare | Biotechnology |
| SOI | Solaris Oilfield Infrastructure, Inc. | 5/12/2017 | Energy | Oil & Gas Equipment & Services |
| SONM | Sonim Technologies, Inc. | 5/10/2019 | Technology | Communication Equipment |
| SONO | Sonos, Inc. | 8/2/2018 | Technology | Consumer Electronics |
| SPFI | South Plains Financial, Inc. | 5/9/2019 | Financial | Banks - Regional |
| SPRO | Spero Therapeutics, Inc. | 11/2/2017 | Healthcare | Biotechnology |
| SPT | Sprout Social, Inc. | 12/13/2019 | Technology | Software - Application |
| SQ | Square, Inc. | 11/19/2015 | Technology | Software - Infrastructure |
| SRRK | Scholar Rock Holding Corporation | 5/24/2018 | Healthcare | Biotechnology |
| SSTI | ShotSpotter, Inc. | 6/7/2017 | Technology | Software - Application |
| STIM | Neuronetics, Inc. | 6/28/2018 | Healthcare | Diagnostics & Research |
| STOK | Stoke Therapeutics, Inc. | 6/19/2019 | Healthcare | Biotechnology |
| STRO | Sutro Biopharma, Inc. | 9/27/2018 | Healthcare | Biotechnology |
| STSA | Satsuma Pharmaceuticals, Inc. | 9/13/2019 | Healthcare | Biotechnology |
| STXB | Spirit of Texas Bancshares, Inc. | 5/4/2018 | Financial | Banks - Regional |
| SURF | Surface Oncology, Inc. | 4/19/2018 | Healthcare | Biotechnology |
| SVMK | SVMK Inc. | 9/26/2018 | Technology | Software - Application |
| SWAV | ShockWave Medical, Inc. | 3/7/2019 | Healthcare | Medical Devices |
| SWCH | Switch, Inc. | 10/6/2017 | Technology | Information Technology Services |
| SWI | SolarWinds Corporation | 10/19/2018 | Technology | Software - Infrastructure |
| SWTX | SpringWorks Therapeutics, Inc. | 9/13/2019 | Healthcare | Biotechnology |
| TBIO | Translate Bio, Inc. | 6/28/2018 | Healthcare | Biotechnology |
| TCDA | Tricida, Inc. | 6/28/2018 | Healthcare | Drug Manufacturers - Specialty & Generic |
| TCMD | Tactile Systems Technology, Inc. | 7/28/2016 | Healthcare | Medical Devices |
| TCRR | TCR2 Therapeutics Inc. | 2/14/2019 | Healthcare | Biotechnology |
| TELA | TELA Bio, Inc. | 11/8/2019 | Healthcare | Medical Devices |
| TENB | Tenable Holdings, Inc. | 7/26/2018 | Technology | Software - Infrastructure |
| TFFP | TFF Pharmaceuticals, Inc. | 10/25/2019 | Healthcare | Biotechnology |
| TIG | Trean Insurance Group, Inc. | 7/16/2020 | Financial | Insurance - Specialty |
| TMDX | TransMedics Group, Inc. | 5/2/2019 | Healthcare | Medical Devices |
| TORC | resTORbio, Inc. | 1/26/2018 | Healthcare | Biotechnology |
| TPIC | TPI Composites, Inc. | 7/22/2016 | Industrials | Specialty Industrial Machinery |
| TPTX | Turning Point Therapeutics, Inc. | 4/17/2019 | Healthcare | Biotechnology |
| TRHC | Tabula Rasa HealthCare, Inc. | 9/29/2016 | Healthcare | Health Information Services |
| TRMT | Tremont Mortgage Trust | 9/14/2017 | Real Estate | REIT - Mortgage |
| TRTX | TPG RE Finance Trust, Inc. | 7/20/2017 | Real Estate | REIT - Mortgage |
| TRVI | Trevi Therapeutics, Inc. | 5/7/2019 | Healthcare | Biotechnology |
| TTD | The Trade Desk, Inc. | 9/21/2016 | Technology | Software - Application |
| TUSK | Mammoth Energy Services, Inc. | 10/14/2016 | Energy | Oil & Gas Equipment & Services |
| TW | Tradeweb Markets Inc. | 4/4/2019 | Financial | Capital Markets |
| TWLO | Twilio Inc. | 6/23/2016 | Communication Services | Internet Content & Information |
| TWST | Twist Bioscience Corporation | 10/31/2018 | Healthcare | Diagnostics & Research |
| TXG | 10x Genomics, Inc. | 9/12/2019 | Healthcare | Health Information Services |
| UBER | Uber Technologies, Inc. | 5/10/2019 | Technology | Software - Application |
| UBX | Unity Biotechnology, Inc. | 5/3/2018 | Healthcare | Biotechnology |
| UMRX | Unum Therapeutics Inc. | 3/29/2018 | Healthcare | Biotechnology |
| UPWK | Upwork Inc. | 10/3/2018 | Industrials | Staffing & Employment Services |
| URGN | UroGen Pharma Ltd. | 5/4/2017 | Healthcare | Biotechnology |
| USFD | US Foods Holding Corp. | 5/26/2016 | Consumer Defensive | Food Distribution |
| USX | U.S. Xpress Enterprises, Inc. | 6/14/2018 | Industrials | Trucking |
| VAPO | Vapotherm, Inc. | 11/14/2018 | Healthcare | Medical Devices |
| VCNX | Vaccinex, Inc. | 8/9/2018 | Healthcare | Biotechnology |
| VCTR | Victory Capital Holdings, Inc. | 2/8/2018 | Financial | Asset Management |
| VEL | Velocity Financial, Inc. | 1/17/2020 | Financial | Mortgage Finance |
| VERI | Veritone, Inc. | 5/12/2017 | Technology | Software - Infrastructure |
| VERX | Vertex, Inc. | 7/29/2020 | Technology | Software - Application |
| VIE | Viela Bio, Inc. | 10/3/2019 | Healthcare | Biotechnology |
| VIR | Vir Biotechnology, Inc. | 10/11/2019 | Healthcare | Biotechnology |
| VITL | Vital Farms, Inc. | 7/31/2020 | Consumer Defensive | Farm Products |
| VRCA | Verrica Pharmaceuticals Inc. | 6/15/2018 | Healthcare | Biotechnology |
| VRM | Vroom, Inc. | 6/9/2020 | Consumer Cyclical | Auto & Truck Dealerships |
| VVV | Valvoline Inc. | 9/23/2016 | Energy | Oil & Gas Refining & Marketing |
| VYGR | Voyager Therapeutics, Inc. | 11/11/2015 | Healthcare | Biotechnology |
| WHD | Cactus, Inc. | 2/8/2018 | Energy | Oil & Gas Equipment & Services |
| WMG | Warner Music Group Corp. | 6/3/2020 | Communication Services | Entertainment |
| WORK | Slack Technologies, Inc. | 6/20/2019 | Technology | Software - Application |
| WOW | WideOpenWest, Inc. | 5/25/2017 | Communication Services | Entertainment |
| WTTR | Select Energy Services, Inc. | 4/21/2017 | Energy | Oil & Gas Equipment & Services |
| XERS | Xeris Pharmaceuticals, Inc. | 6/21/2018 | Healthcare | Biotechnology |
| XGN | Exagen Inc. | 9/19/2019 | Healthcare | Diagnostics & Research |
| YEXT | Yext, Inc. | 4/13/2017 | Technology | Software - Infrastructure |
| YMAB | Y-mAbs Therapeutics, Inc. | 9/21/2018 | Healthcare | Biotechnology |
| ZI | ZoomInfo Technologies Inc. | 6/4/2020 | Technology | Software - Application |
| ZM | Zoom Video Communications, Inc. | 4/18/2019 | Communication Services | Telecom Services |
| ZNTL | Zentalis Pharmaceuticals, LLC | 4/3/2020 | Healthcare | Biotechnology |
| ZS | Zscaler, Inc. | 3/16/2018 | Technology | Software - Infrastructure |
| ZUO | Zuora, Inc. | 4/12/2018 | Technology | Software - Infrastructure |
| Sector | Number of IPOs |
| Basic Materials | 4 |
| Communication Services | 14 |
| Consumer Cyclical | 28 |
| Consumer Defensive | 10 |
| Energy | 17 |
| Financial | 57 |
| Healthcare | 208 |
| Industrials | 24 |
| Real Estate | 19 |
| Technology | 73 |
| Utilities | 1 |
|
Overall (all sectors) |
455 |
Taking into consideration the observation numbers shown in the table above, we can make statistical conclusions about all IPOs generally and the following groups: Consumer Cyclical, Financial, Healthcare, Technology. Other sectors do not contain enough observations for that.
Short-term and mid-term return IPO statistics
In the tables below, the results are presented for 4 terms:
- 1 trading day after an IPO date;
- 2 trading days after an IPO date;
- 10 trading days (2 weeks) after an IPO date;
- 70 trading days (roughly 3.5 months) after an IPO date.
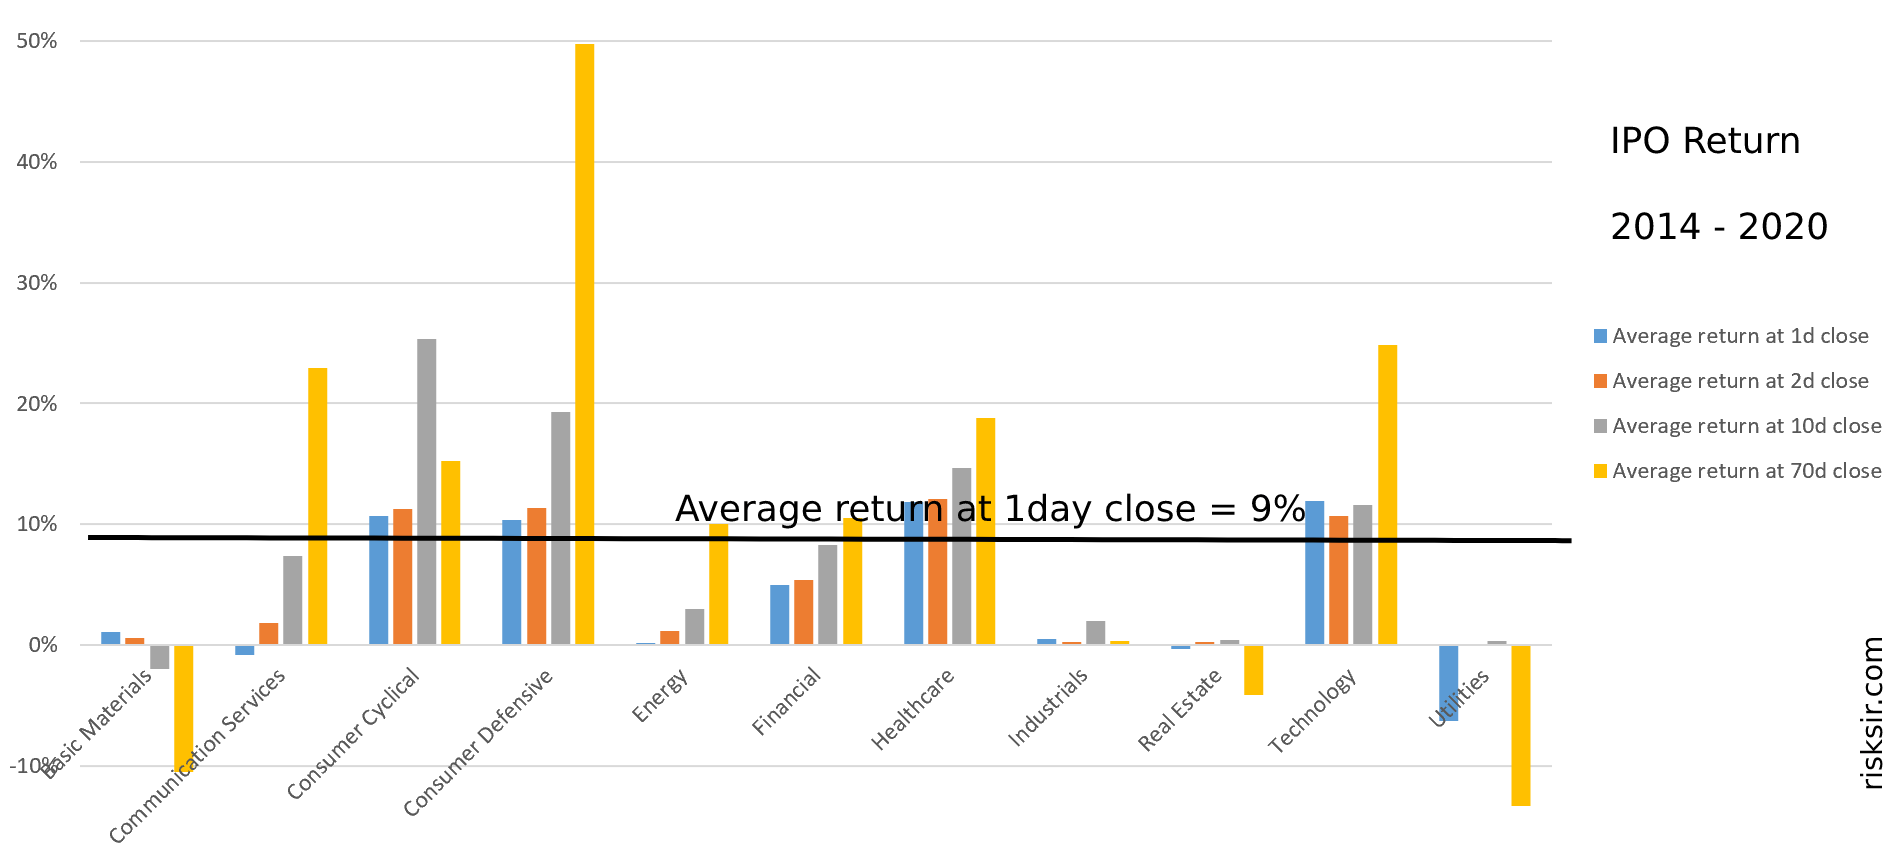
The average returns on offer price
| 2014 - 2020 Sector |
Average 1-day return | Average 2-day return | Average 10-day return | Average 70-day return |
| All Sectors | 9% | 9% | 12% | 17% |
| Consumer Cycl. | 11% | 11% | 25% | 15% |
| Financial | 5% | 5% | 8% | 10% |
| Healthcare | 12% | 12% | 15% | 19% |
| Technology | 12% | 11% | 12% | 25% |
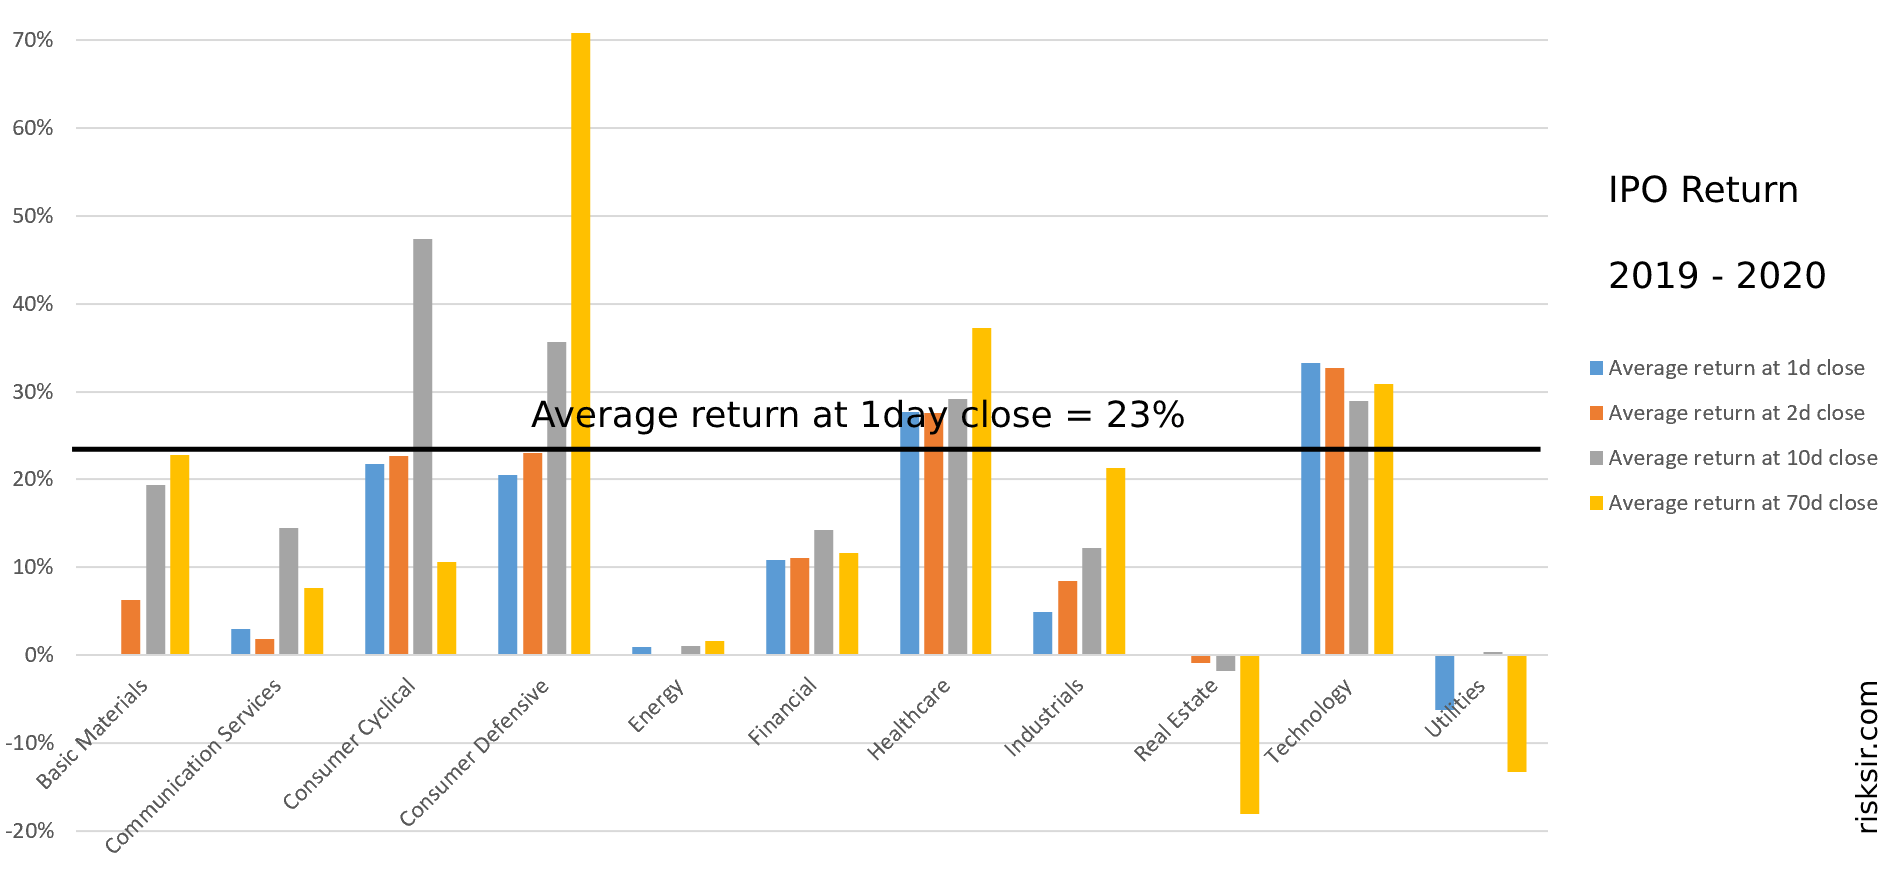
| 2019 - 2020 Sector |
Average 1-day return | Average 2-day return | Average 10-day return | Average 70-day return |
| All Sectors | 23% | 23% | 27% | 28% |
| Consumer Cycl. | 22% | 23% | 47% | 11% |
| Financial | 11% | 11% | 14% | 12% |
| Healthcare | 28% | 28% | 29% | 37% |
| Technology | 33% | 33% | 29% | 31% |
I
Obviously, average values do not carry a lot of information, but they show the result if an investor invested the same amount in all IPOs during the presented periods. Also, averages can be used for a rough (but pictorial) comparison of different sectors.
Compared to the averages, the median values and, especially, distributions give significantly more info about the IPO and post-IPO data — this data is presented below.
The median returns on offer price
In the tables below, the median values for Close of the day and for Minimum of the day are presented:
| 2014 - 2020 Sector |
Median 1-day return | Median 2-day return | Median 10-day return | Median 70-day return | ||||
| Close | Min | Close | Min | Close | Min | Close | Min | |
| All Sectors | 0% | -3% | 0% | -4% | 3% | -7% | 8% | -14% |
| Consumer Cycl. | 0% | -3% | 0% | -3% | 3% | -5% | 15% | -12% |
| Financial | 0% | -2% | 0% | -2% | 2% | -2% | 7% | -5% |
| Healthcare | 0% | -3% | 0% | -5% | 4% | -10% | 9% | -18% |
| Technology | 0% | -3% | 0% | -5% | 6% | -10% | 12% | -18% |
| 2019 - 2020 Sector |
Median 1-day return | Median 2-day return | Median 10-day return | Median 70-day return | ||||
| Close | Min | Close | Min | Close | Min | Close | Min | |
| All Sectors | 9% | 2% | 2% | 1% | 14% | -1% | 18% | -7% |
| Consumer Cycl. | 10% | 4% | 14% | -1% | 28% | -2% | -2% | -21% |
| Financial | 2% | 0% | 0% | 0% | 4% | 0% | 3% | -1% |
| Healthcare | 17% | 4% | 4% | 3% | 18% | 0% | 27% | -10% |
| Technology | 26% | 4% | 4% | 3% | 15% | 0% | 21% | -10% |
Looking at 2014-2020 data, we can see an intuitively fair no-free-lunch situation:
- by buying stocks at a random IPO, an investor has a 50% chance to gain some profit;
- initial IPO price, in general, tends to be "fair" and the market assesses it as fair.
However, the landscape for the last 2 years, 2019-2020, differs dramatically:
- the chance to win for an investor was much better than 50/50;
- enormous growth (especially on the first trading day), the numbers are significantly higher than could be expected based on previous data.
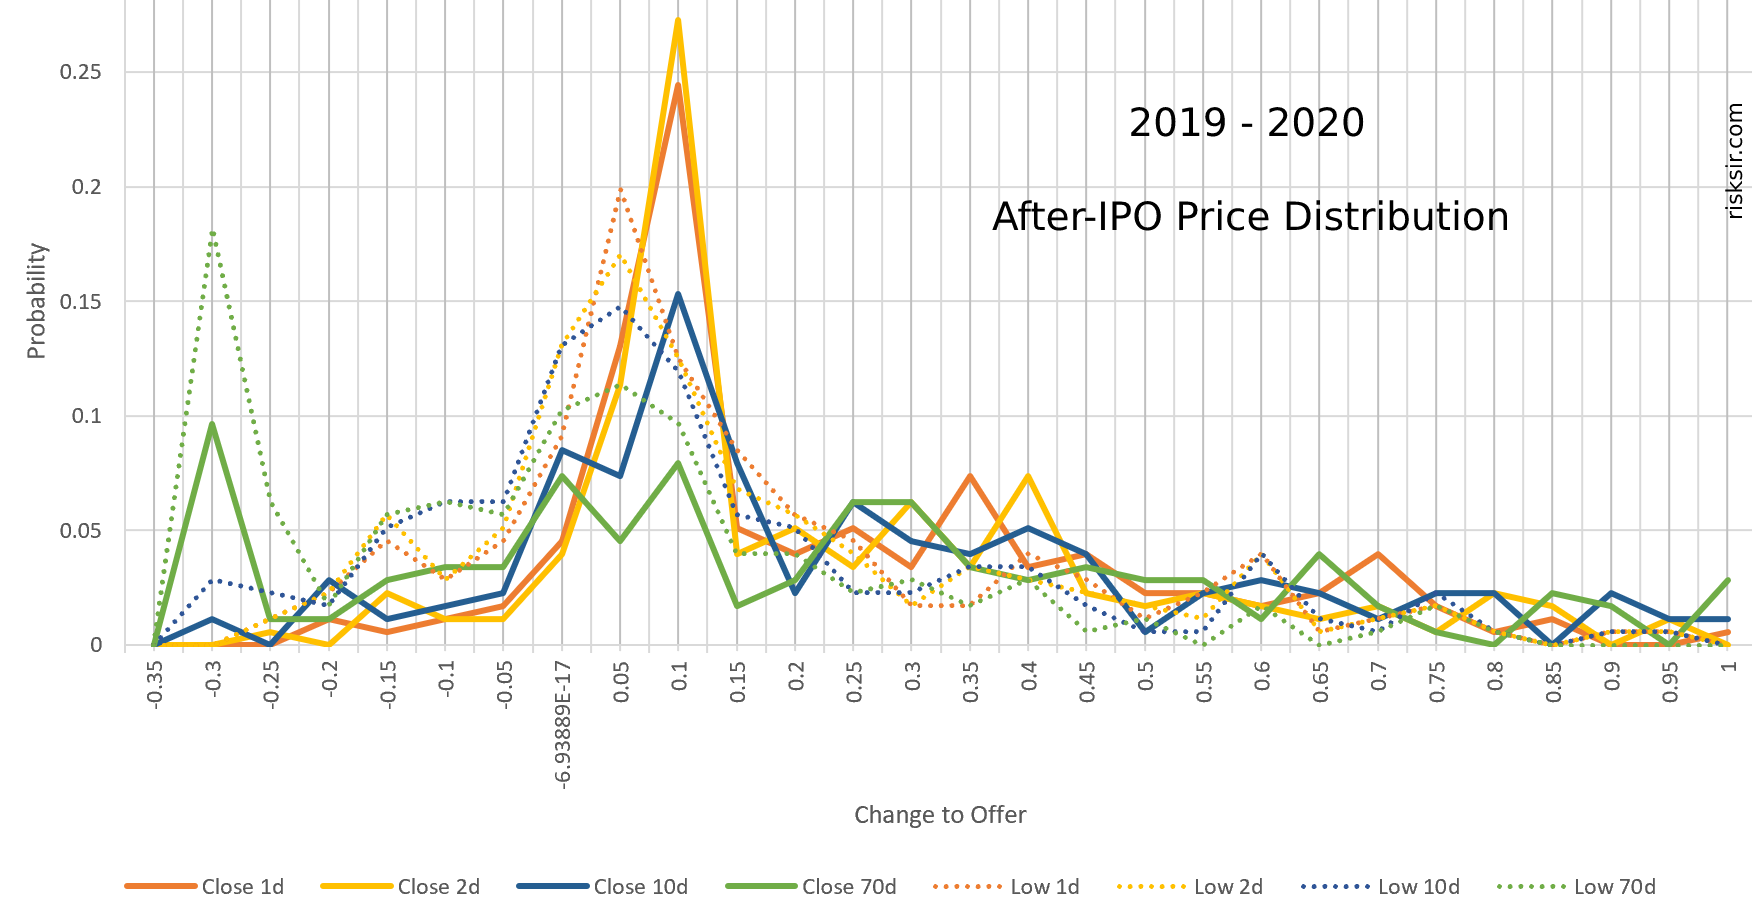
Distribution of IPO returns
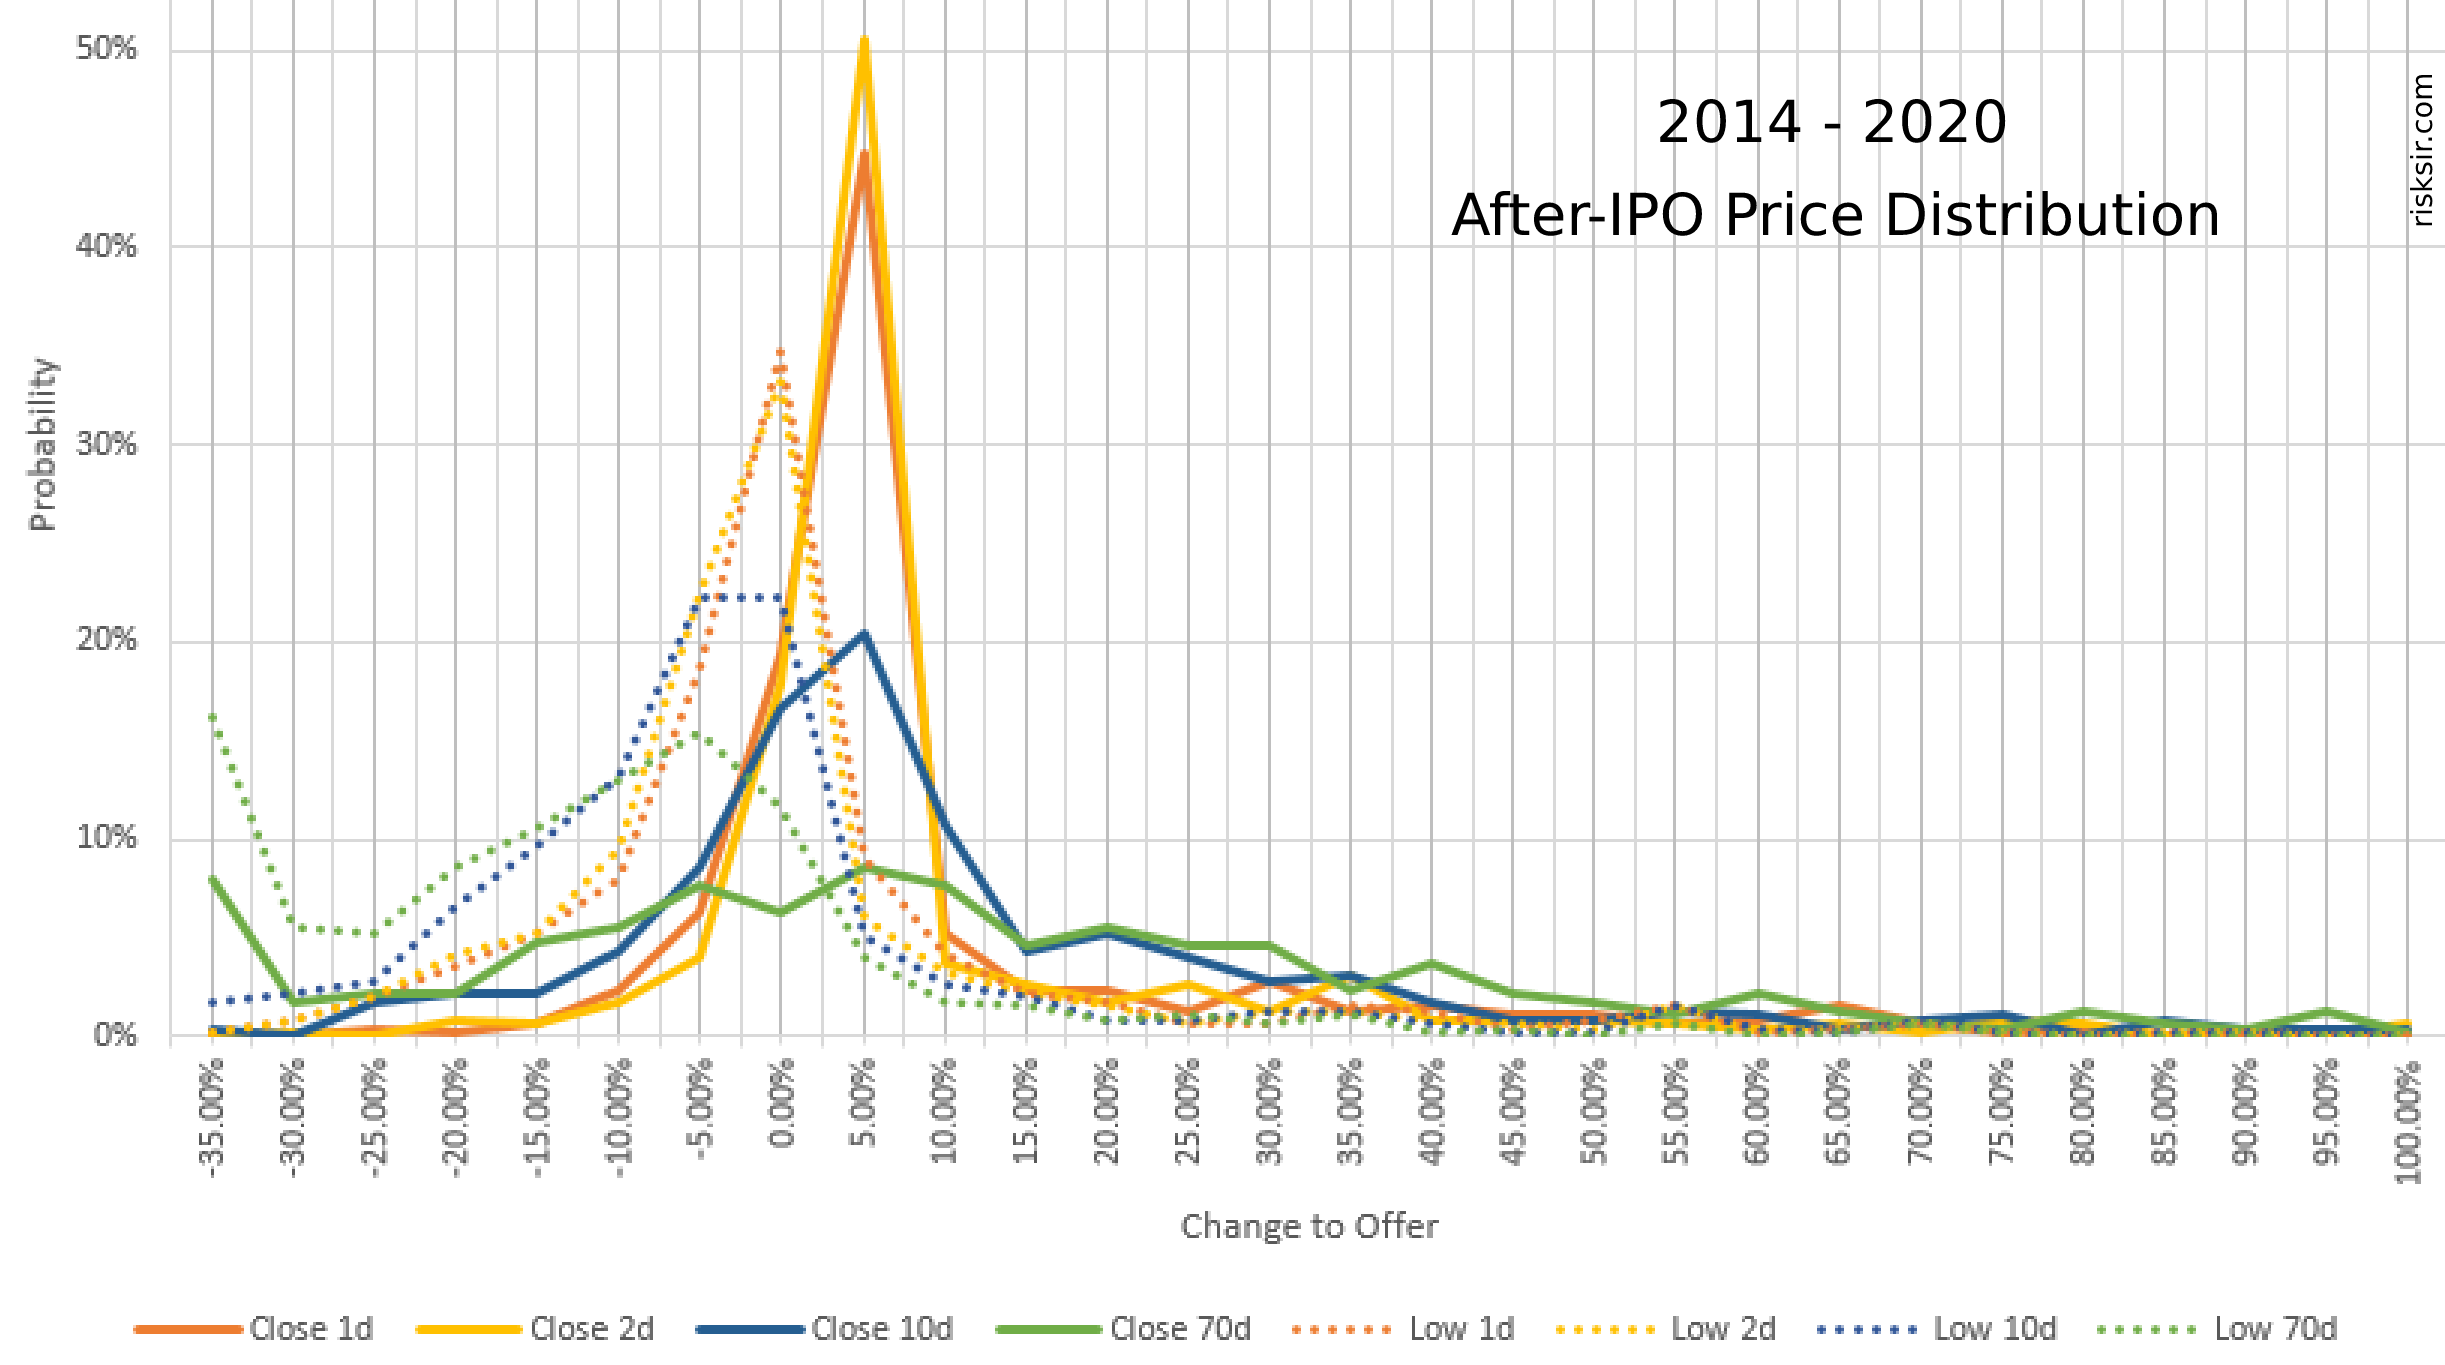
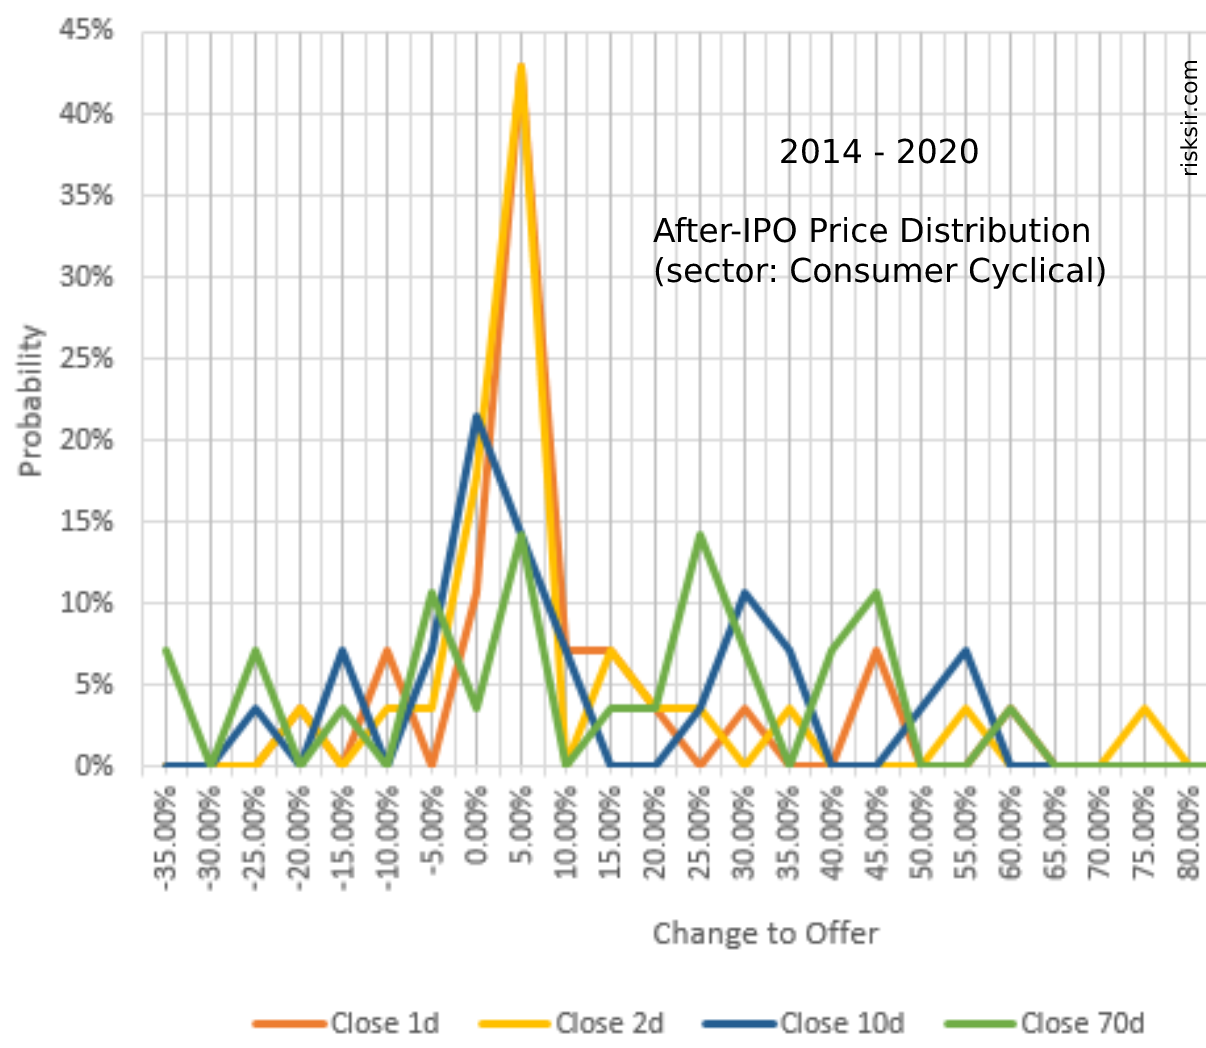
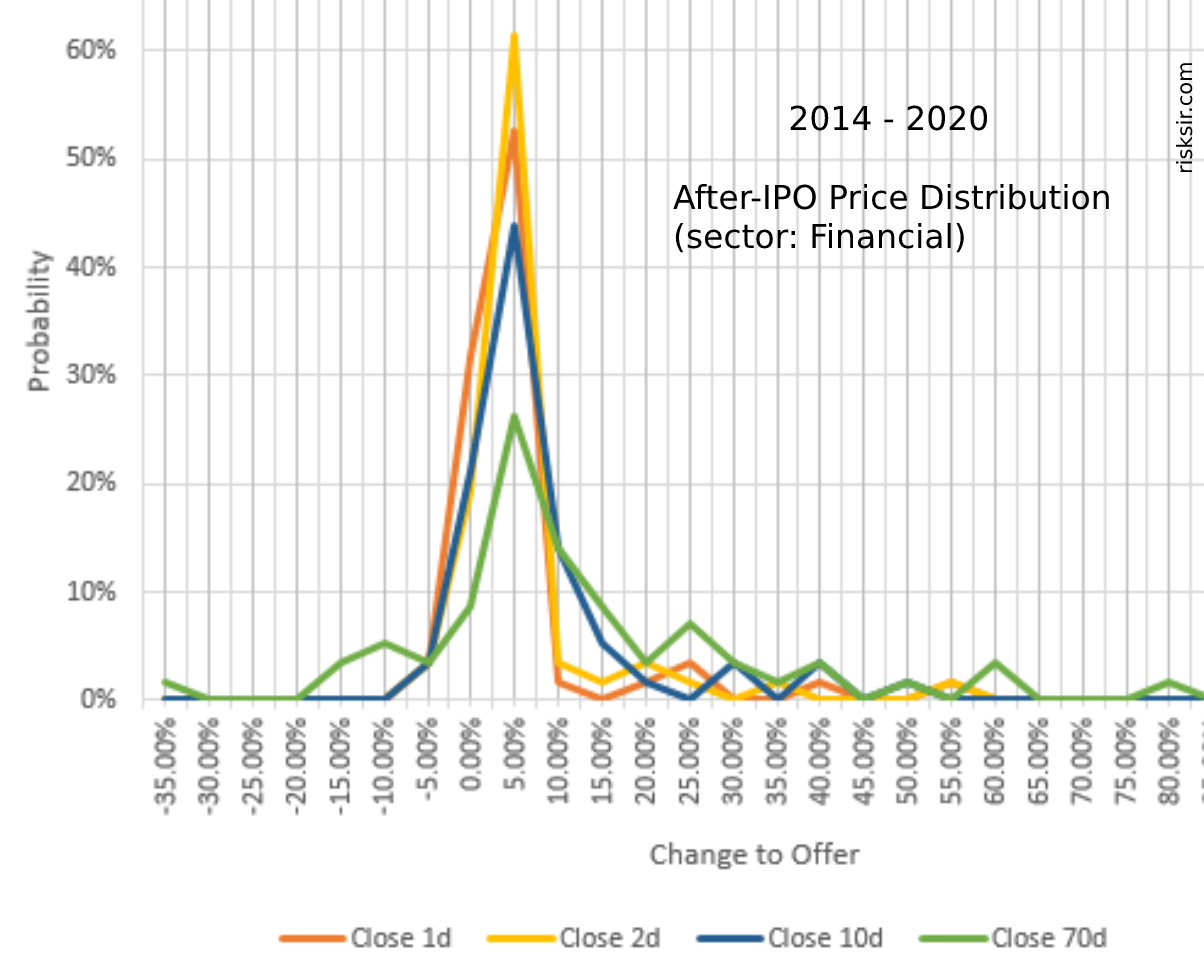
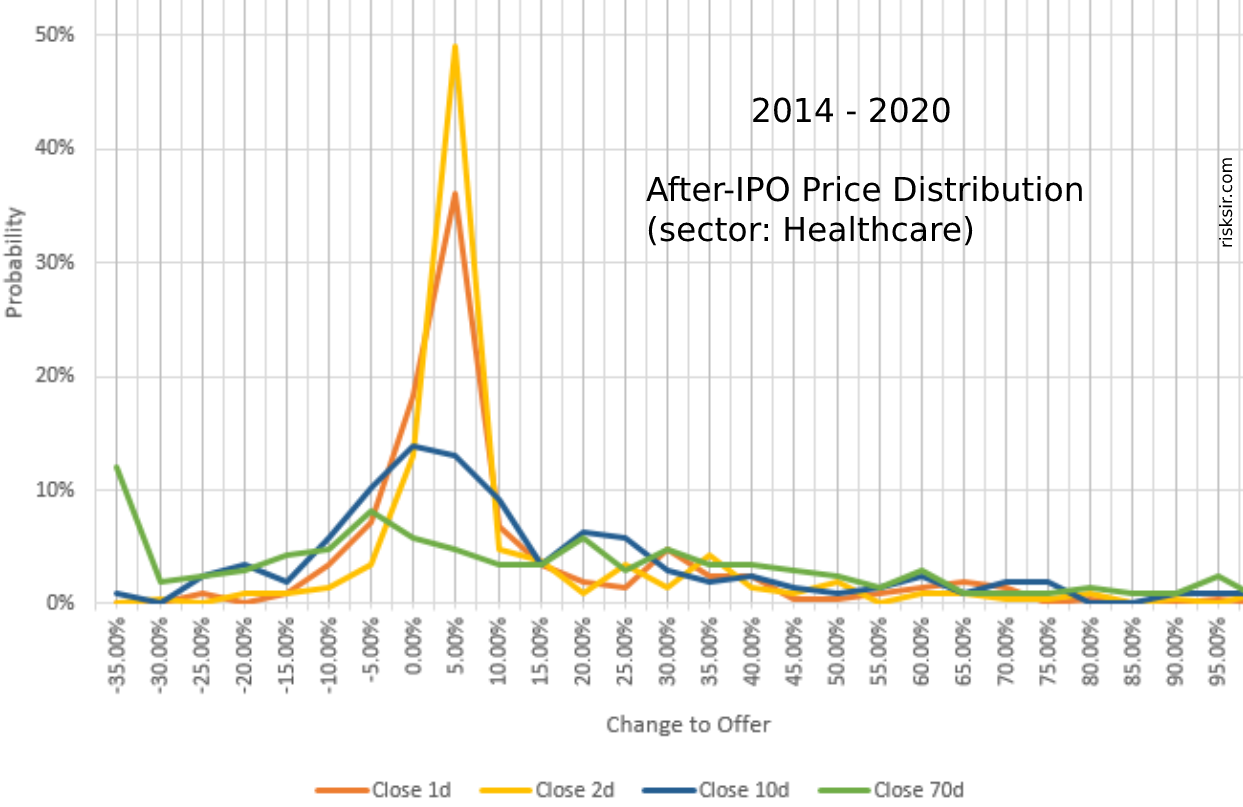
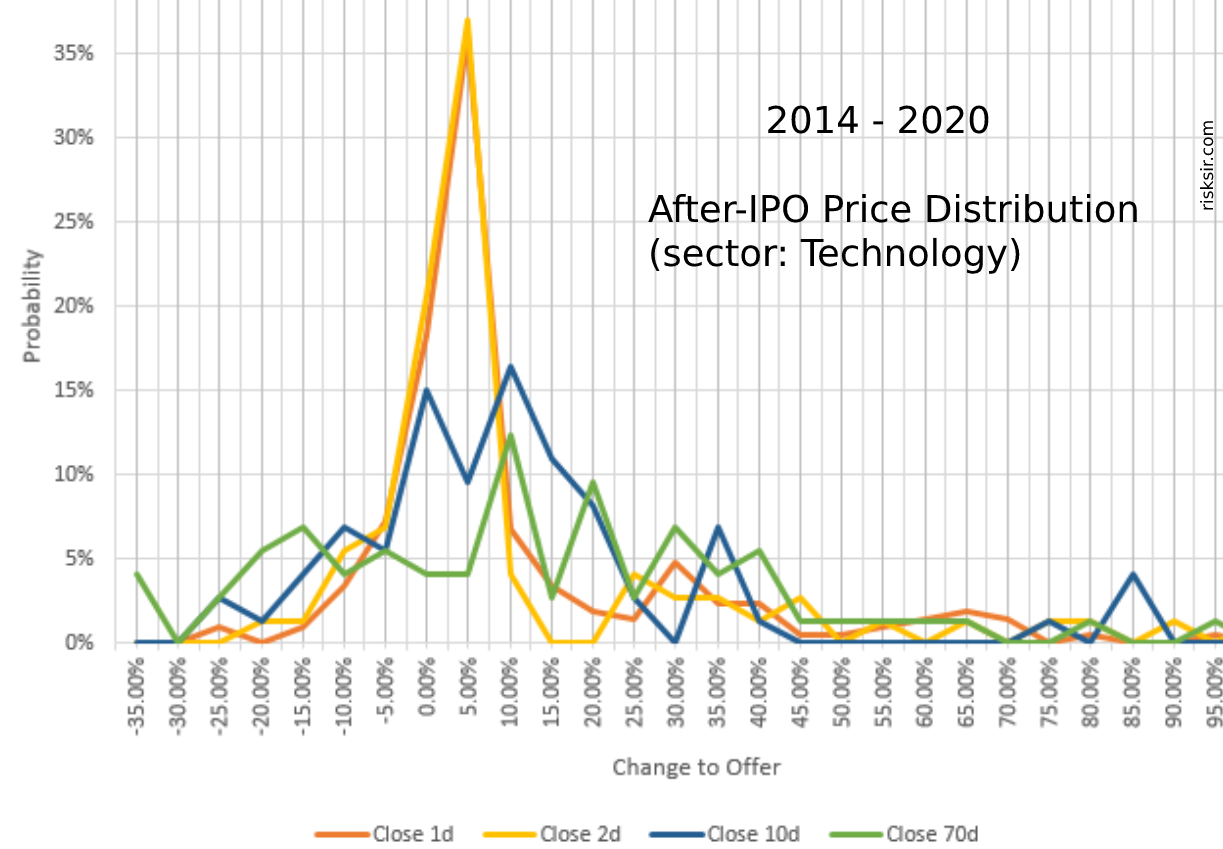
The 2019-2020 IPO return distribution has the apex shifted to the higher returns and also havier right tail. And these shifts are more clear for short terms, 1-10 days after IPO.
Instead of conclusion
The visual materials and numbers presented above can be pretty useful for making investment decisions and building data-based expectations. However, an important takeaway is the demonstrated fact that there is a blatant and strong deviation of IPO price behaviour between the "normal" state and the 2019-2020 "IPO-hype" period. Hence, it is rational to expect that without extraordinary liquidity, which has been injecting into the market during the last couple of years, the IPO investor's results will be less shining.
Useful pages with IPO analysis (updating)
- IPO stats by Jay R. Ritter: https://site.warrington.ufl.edu/ritter/ipo-data/
- Last 100 IPOs by IPOScoop: https://www.iposcoop.com/last-
100-ipos/ - After-IPO stock parameters by Finviz: https://finviz.com/
screener.ashx?v=141&f=ipodate_ prevquarter - IPO trends by EY: https://www.ey.com/en_gl/ipo/trends
- U.S. IPO statistics by Statista: https://www.statista.com/topics/1272/ipos/
Ivan Samkov, 2021